


 Visual alarm devices (VADs) are used to warn deaf and hard of hearing people in the event of a fire, and to provide silent warnings where required. The effectiveness of VADs, most of which are Xenon or LED flashing light devices, in gaining the attention of people is critical to providing reliable warnings. VAD effectiveness has been investigated in this study, using one Xenon device and five different LED devices of varying light pulse durations.
LED VADs can be designed to produce a broad range of pulse types with varying degrees of effectiveness at providing fire warning. With increasing capabilities of modern LEDs a private client commissioned BRE to investigate whether the flashing signals from LEDs could, and under what conditions, be as effective as those from Xenon's.
Conducted by BRE's Fire Detection group at its test facilities in Watford, UK this study has investigated the:
- relative performance of Xenon and LED (with light pulse durations of < 40 milliseconds) VADs,
- effect of decreasing pulse durations in LED devices,
- effect of using warm white and cool white LED devices,
- effect of the ambient light level,
- proposal to change the constant used in the Blondel-Rey formula.
- Calculating VAD effectiveness
Test standards around the world use the Blondel-Rey formula to calculate the effective luminous intensity (Ieff) – expressed in candela (cd) – of pulses generated by Xenon and LED VADs. This calculation is used to rate a device's warning effectiveness.
To calculate effective luminous intensity the light output from a single pulse is integrated over time and divided by the sum of a constant 0.2 seconds (s) and the pulse duration (in seconds). According to the Blondel-Ray formula, effective luminous intensity can be the same for a Xenon device producing a high peak intensity with very short pulse duration (typically less than 1ms), and an LED device with a very low peak intensity that can produce very long pulses (up to 200ms). If the calculated values from these are the same then human responses to a direct presentation to both should be similar.
However, whilst the basis of the Blondel-Rey formula is a study involving the direct viewing of light sources, visual warnings are actually most often detected though indirect viewing, i.e. seeing the light in the peripheral vision. This has led many to question the suitability of the formula for the rating of fire warning devices intended to alert people. Reports on other studies in this area include a proposal from the Light Research Center (LRC) that the use of an amended constant – 0.01 s instead of 0.2 s –is more suitable.
This study specifically investigated the relative responses of people to Xenon and LED flashing devices with shorter pulse durations (< 40ms), and to test the LRC proposal for the formula constant. The effect of the colour temperatures of LED devices was also examined, using a combination of cool white and warm white LED VADs.
Test Methodology
The pulse durations and effective luminous intensities of the six VAD devices tested are shown in the table.
To test the different devices, volunteer participants were seated at a desk in front of a screen with the following ambient illumination levels:
- High ambient condition: 500 lx on a table top and 200 lx on a screen.
- Low ambient conditions: 250 lx on a table top and 100 lx on a screen.
Test Room Conditions
The test room parameters, such as its dimensions, light fitting locations, and the reflectance levels of all surfaces, were input to a DIALux program. The program uses this data, together with the specifications from a database of light fittings, to identify the most appropriate set-up to produce the required illumination levels. The DIALux program identified four wall-washer light fittings that, using a dimmer switch, would most closely meet those requirements.
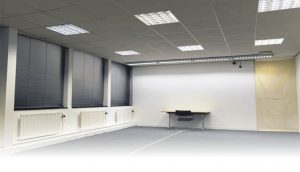
A simulation from the DIALux program is shown in Figure 1, and a photograph of the actual illumination level for the high ambient condition is shown in Figure 2.
A non-uniform distribution of illumination on the screen could be a contributing factor to subject responses, if they were naturally more attuned to detecting contrast variations. Using the simulation and wall-washer lighting, this variable was controlled and a relatively uniformly lit screen and table top was achieved under the high and low ambient light level conditions.
Light distribution tests were performed on the six different devices to identify their peak light levels and effective illumination distributions. The data generated from these tests were plotted on a colour contrast chart to give a visual representation on a screen opposite the device (at 5m) of the effective light contrast and effective illumination distribution. Two of these are shown in Figure 3, for the Xenon device (left) and the cool white 10ms LED device (right). The Xenon VAD was modified using two filters to give the distribution shown, as the original distribution from the device was more like that from a spotlight.
These distributions were considered similar in terms of the peak effective illuminations, directly opposite the devices, at (0, 0) and the effective illumination distributions.
Figure 3: Effective illumination distribution (lx) of Xenon (L) and cool white 10ms LED (R) devices. Image courtesy of BRE.
Participant Selection and Test Procedure
The three main variables identified as potentially affecting the responses of the volunteer test participants, were gender, age and whether they wore glasses. Sets of 12 participants were selected to take account of gender (M/F), glasses (Y/N) and age group (<40, 40-60, >60). It was established that eight sets would be required to have sufficient statistical data, totalling 96 participants.
Volunteers matching these demographic profiles were contacted using the BRE research project volunteers' database. They were told that the work was part of an office environment research project that was investigating how well people were able to concentrate under different light and sound level conditions, whilst performing a written arithmetic and comprehension test. The volunteers were also informed that there was a chance of winning £100 for scoring the highest in the tests.
The experiment was designed to distract the participants from the true purpose of the test, with the prize money introducing a competitive element that focused their attention during the trials and prevented them from looking out for the flashing light.
 The participants were seated at a desk in front of the screen and were given two written exercises to work through. They were instructed to raise their hand if they became aware of a flashing light and then continue with the test. The flashing signals from the six devices were presented individually to all participants in a random order. They were flashed one at a time from a distance of 19m and then gradually brought closer to the screen until the subjects responded. The devices were aligned such that the normal axis was in line directly above the test subject's head and 2m from the ground.
Two looped sound files of a typical office environment were played in the background at a level of 45±5 dB. This served to cover sounds from the popping Xenon VAD, the wheels of the trolley on which the devices were mounted and switches being changed on the control box.
Following the test a short, simple examination of peripheral vision was conducted on every participant to check for any unusual responses (due to visual impairments) that could skew the data. Advice from an optometrist was taken on how to perform a basic peripheral vision test.
Further details of issues such as the limitations of human peripheral vision, the participant selection process, the pulse profiles of the devices tested, the methodology for normalising devices, and the analyses of sample numbers and demographic sets, can be obtained from the briefing paper available from the BRE website.
Analysis and Conclusions:
Peak Performance
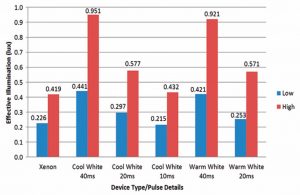
The participant's average response distance measurements were used to calculate the effective illumination levels at the peak performance for each device, for both the high and low ambient light level conditions. Low levels of effective illumination indicate that less light was required to alert participants to the flashing lights (i.e. they were seen from a greater distance and were thus more effective).
The results demonstrate that the Blondel-Rey formula does not lead to similar effective illumination levels, in terms of the response of participants, for different pulse types and durations. If that was the case, all of the values under low ambient conditions would have been at the same level, as would all of those under high ambient conditions.
The following conclusions were drawn from these results:
- As pulse durations of LED devices shorten the attention drawing effectiveness increases (this is true for both warm and cool white light in both high and low ambient light level conditions).
- The Xenon and 10ms cool white LED devices were more effective than the 20ms cool white and warm white LED devices, which were in turn more effective than the 40ms cool white and warm white LED devices.
- The responses from warm white LED devices and the equivalent cool white devices are at similar levels.
- The responses from Xenon and 10ms cool white LED devices were similar under high and low ambient light level conditions, indicating that LED devices run at shorter pulse durations can be as effective as Xenon devices.
The Blondel-Rey Constant
The study by the LRC had reported that the use of the constant a=0.01s was more appropriate than 0.2s. This was investigated by comparing the results from all six device types and using a multiplying factor to convert the effective illumination levels recorded for each of them.
The revised data indicated that the peak performance responses for the LED devices were more comparable; however this was not the case for the Xenon device. For Xenon devices the proposed new constant is not appropriate because their pulse duration (typically <1ms) is significantly shorter than the constant 0.01s. When using this constant the pulse duration of the Xenon device effectively plays little or no part in the denominator that forms part of the Blondel-Rey equation. Further work is required on Xenon devices with different pulse durations and peak intensities to identify a suitable formula that would equate their responses to those of LED devices.
LED Benefits
One of the benefits identified of using LED devices is that the arrangement of a single light source in a lens is more conducive to producing a uniform distribution to provide effective warning throughout a protected space. To match this using a Xenon tube in a complex arrangement incorporating a lens and various reflectors is a challenge. Thus LED devices can more readily be configured so that they alert people located anywhere in the protected space, rather than just highly illuminating selected areas.
More Information and Future Work
Further details of this work can be found in a briefing paper and a video detailing the research work which are both available from the following website address: www.bre.co.uk/firedetectionresearch
Further work on VADs is due to take place in collaboration with a number of other interested parties. This will investigate the effects of:
- using VADs with different colours,
- a wider range of background illumination levels,
- a wider range of pulse durations